
The Bull’s Head Risk Matrix is developed to assist risk assessment, which, by nature, is a subjective affair. The Risk Matrix forces us to base the assessment as much as possible on data, information and understanding, making the assessment as objective as possible.
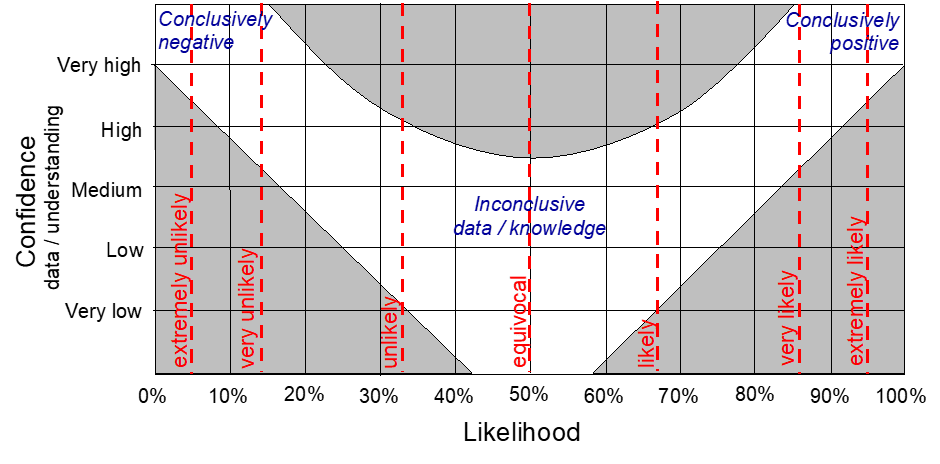
While the matrix was developed for oil and gas exploration, it can be used just as well for risk assessment in any other field. The basic premise of this matrix is that an estimate of likelihood versus confidence should always fall in the non-shaded bull’s head shape. Lots of data/information and a good understanding should result in high confidence which should allow us to almost conclusively say whether a risk is very high or very low (conclusively positive or negative). Conversely, when we have little data and understanding and confidence is low, the risk should fall not too far from a 50/50 estimate (equivocal). With little confidence we should not polarise the risk to low or high values.
The Risk Matrix in oil and gas exploration
The Risk Matrix is to be used for the ‘chance’ assessments of the considered risk elements. In its most simple form these are the main play elements: Trap (or structure), Reservoir, Seal and Charge. It is not meant to be used for a direct total prospect POS (Probability of Success) assessment. The percentage chance of each of the risk elements are multiplied to arrive at the prospect POS.
A brief history
The matrix that I like to use is shown in the figure above. But there are other ways bull’s head matrices have been drawn. In essence they all mean to do the same: making risk assessment as objective as possible. It does so by forcing the evaluator to use all data and knowledge as well as possible. This should go some way to overcome any biases that we may be subject to.
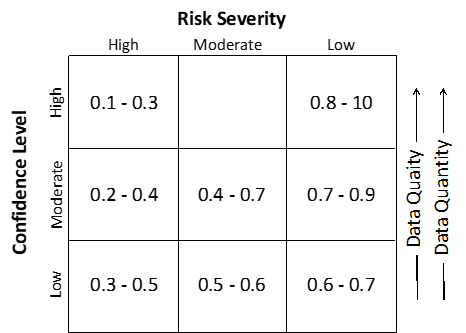
If I am not mistaken, a risk template for prospect assessment was initially proposed by Rose & Associates. To the left I have redrawn a template from Peter R. Rose’s book ‘Risk Analysis and Management of Petroleum Exploration Ventures’ (2001). Note that just like the bull’s head matrix this plot recognises that with lots of good quality data and high confidence, the risk assessment should be either low or high, and not moderate.
Matrices constructed later all have a bull’s horns shape to indicate that with low confidence the risk assessment should be moderate (around equivocal: 50/50), and not very high or very low – and that with high confidence the risk cannot be moderate.
The template was initially developed in Woodside and was introduced in Shell during the early 1990’s by Ian Longley (during his years with Woodside) to harmonise risk assessment in all of Shell’s exploration offices worldwide. My version of this matrix is shown in the figure at the start of this post, some other manifestations are shown below:
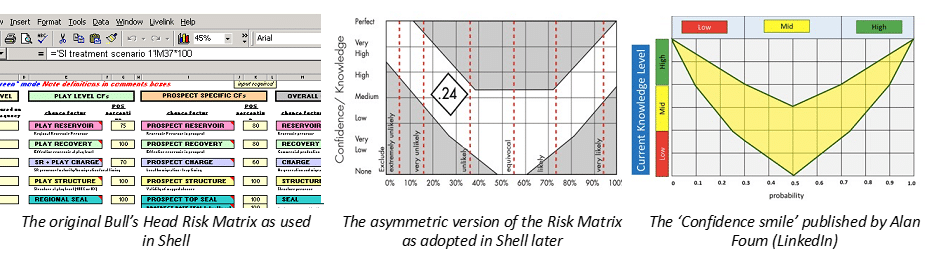
The precise outlines of the ‘horns’; should in my mind not be taken too literarily. Philosophically I agree with Alan Foum’s Confidence Smile that the horns should end in points. Only when you are 100% confident and have perfect knowledge it is possible to assign a 0% or 100% probability (a presentation by Alan on risk assessment, including the Confidence Smile, can be found at: https://lnkd.in/gqBjVs89). The asymmetric version as published in Shell’s PBE Handbook is less appealing to me as it implies more precision than I think is justified. And I find it a bit difficult to accept that ‘equivocal’ is not 50% (55% in the asymmetric template). The Shell PBE Handbook with the asymmetric risk template can be downloaded at: https://iba.aapg.org/resources/training/play-based-exploration.
In the end these minor differences of the Bull’s Head risk matrix probably don’t matter too much. What matters is its philosophy of looking at risk and how we use the matrix.
The Vertical Confidence axis
On the vertical axis ‘Confidence – data / understanding’ we should plot the degree of confidence that we have in our estimate of likelihood (chance) that the considered risk element is indeed present in our prospect. How much do I know and how well can we assess the risk? Confidence is normally based on the amount and quality of the data available to us and on our understanding of the risk element (trap, reservoir, seal, charge). Obviously, the degree of confidence is a subjective assessment, hence the simple subdivision of this axis from Very High to Very Low.
Sometimes we don’t need a lot of data for a very good understanding, and sometimes our understanding is limited despite a lot of (maybe conflicting) data. With lots of data available in our databases we must be careful to only consider data that is representative for our prospect. While plots displaying large amounts of data may superficially look impressive and even scientific, if much of the data is not representative, the value of such plots is limited and can even be misleading. This could be the case if, for example, net/gross data for a reservoir is plotted with most of the data coming from a different depositional environment than what we expect for our prospect, or if for porosity data most of the measurements come from shallower or deeper depths than that of our prospect.
A common mistake is confusing confidence for ‘likelihood’. Many people think that if the presence of (for example) reservoir is likely, confidence should be high. And if it is unlikely, confidence should be low. That is not correct. We can be extremely confident about a risk element not being present. For example, data may virtually conclusively indicate that no source rock (or reservoir, or whatever) is present. I think that most readers have come across cases where there is lots of data to indicate that reservoir or seal is not present.
In some cases, when there is not much data available my geological understanding can be such that I can still be very confident about the presence or absence of a play element. For example, I will normally be extremely confident that a source rock will not be mature if it has never been buried more than (say) 1 kilometre – even in the absence of any maturity data. Likewise, I am normally pretty sure that a reservoir at a depth of some 10 km will not be effective – also if I don’t have any measured porosities. This is because my geological understanding tells me that source rocks will not be mature at a depth of less than 1 km, and that reservoirs will be tight at a depth of 10 km. I am sure many of you will now start to think of situations where a source rock shallower than 1 km can be mature and where a reservoir may be effective at a depth of 10 km.
The above is meant to make clear why in the subtitle of the Confidence axis not only data is mentioned but also understanding.
The Horizontal Likelihood axis
On this axis we plot our assessment of chance (or likelihood) for the considered risk/play element. What is the chance that the risk element is indeed present. To come to a percentage chance, the best way is to first list all negative and all positive factors for the risk element (reservoir for example). This is best done in an open group discussion with people with different backgrounds and expertise and by writing all suggestions for positive and negative evidence and considerations on a flip chart. Most of us have no problems coming up with factors that suggest that the risk element may be present. That is our nature as explorers. But we should also try also to come up with negative evidence and considerations for the risk element. This should be done by looking at what the available data tells us. And it is often helpful to pretend that the exploration well has been drilled and proves that the risk element (reservoir for example) is not present. How would we explain that? Might it be missing due to local erosion, non-deposition, by-pass, shale out, …?
Based on all positive and negative evidences and considerations we must then express the chance that the risk element is present in terms of ‘likelihood’: likely, very likely, extremely likely, etc. The degree of likelihood can then easily be translated in a percentage. The approximate percentages for each degree of likelihood are indicated in red lines on the Bull’s Head plot – see below for more on the topic of ‘degree of likelihood to percentage’.
In this process we should resist the temptation to call out numbers (percentages) too soon. In an open discussion it is easier to agree in on a degree of likelihood (likely, very likely) than on a percentage. Calling out a percentage at the start of the discussion has 2 negative effects. Firstly, we influence others, and secondly, we then tend to want to stick that percentage. We will then try to defend the assessment, rather than listening to others and be open for changing our mind. Instead of trying to find reasons to justify our early gut feel; we should first be made aware of all data, geological understanding and considerations, and then we can base our assessment as much as possible on that. In this process we need input from a diverse group of geoscientists, each with his/her own expertise and willing to listen to others. But in the end, it is a subjective assessment, and different people will come to different percentages of chance.
From Degree of Likelihood to Percentage
The risk matrix shows vertical red lines for degree of likelihood at certain percentage values. The position of these lines is actually based on research. In Shell this was presented by Coiffinier (1975) and was illustrated in the plot copied below. I could not find any open source references to this research, although I have seen that other organisations (the IPCC for example) also use the words very likely for 85% and extremely likely for 95%.
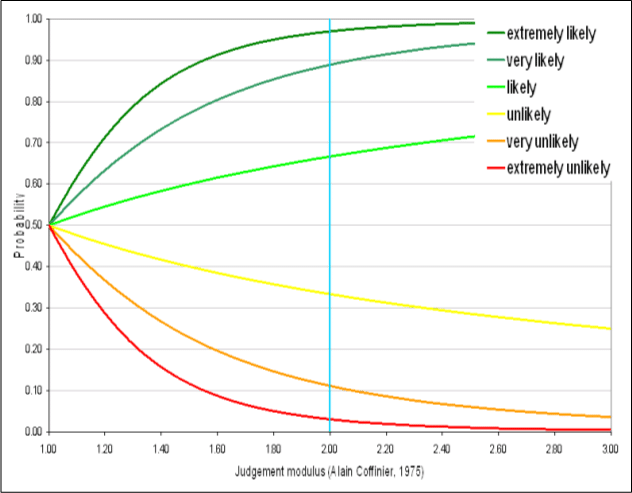
The plot shows how terms like likely and very likely should be translated in a percentage chance. You can see that the precise percentage depends on the ‘Judgement Modulus’. The research I referred to concludes that for ‘experts in their field’ a judgement modulus of about 2 is appropriate (the light blue vertical line). You can see that all positions of the red likelihood lines in the Bull’s Head risk matrix conform to this.
For people who are not experts in their field a lower Judgment Modulus is appropriate. When they judge something to be extremely likely it does not mean that the chance is 95%: it is a (much) lower chance. They tend to be overly (unjustified) confident. This is something to be aware of, in particular for those who think that any opinion should have the same weight.
Read the next volume of the blog series:
- Rethinking Trap Distribution Through Seal Effectiveness
- Reporting Risk & Volume Assessments: Key Insights and Best Practices
- Prospect Police versus the Socratic Method
- Data Acquisition for Exploration: Risk Reduction or POS Polarisation?
- Exploring Stratigraphic and Combination Traps: Definitions, Risks, and Applications
- Optimizing Risk & Volume Assessments in Mixed Hydrocarbon Fields
View upcoming related courses:
Trap & Fault-Seal Analysis, Modeling for Oil & Gas and CO2
